Bitcoin Eyes $170K as Elliott Wave Signals Bullish Q3
July Rally Sets the Tone for Q3
Bitcoin extended the uptrend in July, gaining over 10% by on the month.
Q3 2025 is shaping up to be strong for BTC.
Legislative Wins Spark Market Optimism
The key driver for this rally was the passage of three cryptocurrency-related laws: the Anti CBDC Act, which blocks the creation of a central bank digital currency; the CLARITY Act, which classifies tokens without profit promises as commodities, placing them under CFTC oversight instead of the SEC; and the GENIUS Act, allowing banks to issue fully dollar-backed stablecoins pegged to short-duration US Treasuries.
Elliott Wave Count: The Bullish Roadmap
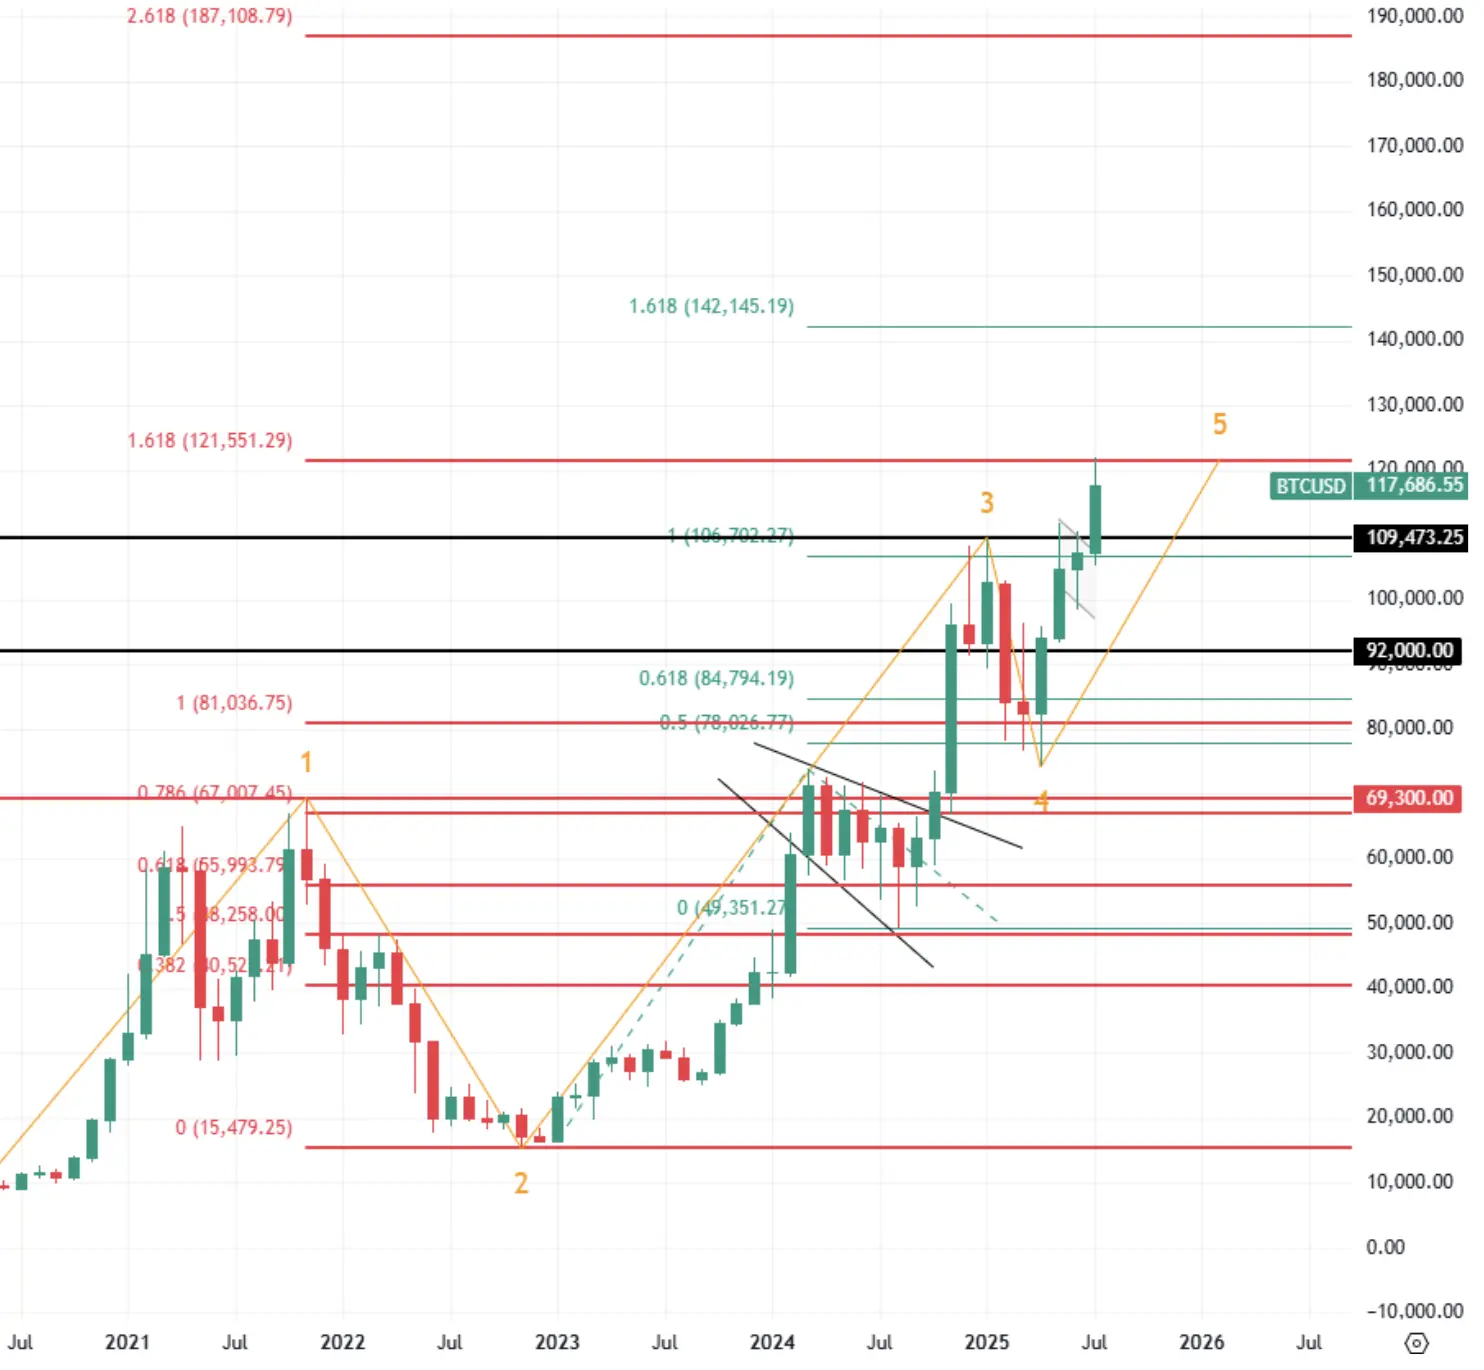
From the TA standpoint, the BTCUSD pair’s upside potential can be assessed using the Elliott Wave Theory, as we did in May.
Back then, we outlined two scenarios: either the formation of a fifth impulse wave targeting $121k or a pullback to $75k if our wave count and chart analysis were off.
The former scenario played out, rendering the second one irrelevant.
Bitcoin remains in an upward impulse wave, and several potential paths forward are now in play.
Two Scenarios, Multiple Targets
In the long-term outlook, two wave count scenarios emerge.
Scenario 1.
The first wave formed during the rally from March 2020 to November 2021.
The second wave, a corrective one, followed the price drop from roughly $69k to $15.5K, making it relatively deep.
The third wave, the strongest impulse phase, kicked off in January 2023.
Two possibilities arise at this junction:
The third wave may have ended in January 2025, stretching beyond 100% of the first wave, consistent with Elliott Wave principles.
If so, the fourth wave unfolded over the first four months of 2025 and was equal to 38.2% of the third wave – a standard retracement.
The fifth and final wave is currently underway and could extend up to 100% of the third wave. This is an upbeat call, according to which Bitcoin could hit $170k.
However, if the fifth wave is complete, a protracted correction could drag the price action below $70k.
Alternatively, the third wave is still ongoing and even more extended.
In this case, a target like 261.8% of the first wave – around $187k – comes into the picture.
A breakout and consolidation above $121.5k would signal continued upward momentum.
Scenario 2.
This scenario is not at odds with the first and could even be a subset of it, which is worth keeping in mind in terms of future analysis.
Here, the impulse move began with the price action from November 2022 to March 2024, forming the first wave.
The second corrective wave ran from March 2024 to August 2024, retracing about 38.2% of the first wave, in line with Elliott Wave principles.
The third impulsive wave got under way in September 2024 and ended in January 2025, measuring exactly 100% of the first wave.
Similar to Scenario 1, two paths emerge: either the third wave extended from January to April 2025, concluding with a 50% retracement, or it remains unfinished and extended further.
If the third wave is still in play, the next upside target would be $142k.
If it is complete, Bitcoin is now in the fifth wave, potentially peaking at around $135k.
Key Levels to Watch in the Months Ahead
In a nutshell, the most bullish scenario projects Bitcoin reaching $187k.
Along the way, several key levels will either validate or challenge this outlook.
The first test is whether the bulls can break and hold above $121.5k.
The next hurdle is hitting and surpassing $135k, followed by $142k.
The final barrier would be $170k. A correction could kick in at any of these points, prompting a reassessment of wave counts.
For the time being, the trend remains firmly bullish, giving us reason to maintain an optimistic outlook for BTC.