Bitcoin Volatility Spikes as Trump Floats US Crypto Reserve Plan
February Market Overview: 18% Decline and Political Catalysts
BTCUSD experienced nearly a 18% decline in February, with the most pronounced volatility seen late in the month as prices breached the $90k threshold.
This downturn followed President Trump’s confirmation of escalating trade tensions during a joint press conference with French President Macron.
Over the three-day period from February 26 to 28, the DXY Index printed gains, while BTCUSD depreciated sharply.
#3 Trump’s Cryptocurrency Summit Announcement and Market Response
Market sentiment subsequently shifted in the aftermath of President Trump’s announcement of a cryptocurrency summit scheduled for March 7, bringing together founders and executives from prominent crypto ventures.
Trump suggested that select cryptocurrencies could potentially form the core of US reserve holdings.
This announcement triggered a sharp spike higher, with BTCUSD briefly topping $95k.
Challenges of the US Crypto Reserve Proposal
However, the proposed cryptocurrency reserve concept faced immediate pushback over how exactly the government would purchase tokens.
The inherent volatility of cryptocurrencies, alongside the perceived lack of transparency surrounding the political objectives of such investments, has fueled skepticism. Consequently, BTCUSD retreated below the $90k level.
Market Dynamics and Pump-and-Dump Concerns
The market dynamics observed in late February and early March bear a resemblance to a classic pump-and-dump scheme, characterized by information-driven price inflation followed by a rapid distribution at peak valuations.
Nevertheless, the cryptocurrency market has historically exhibited high volatility, and President Trump’s involvement likely amplified these fluctuations.
Technical Analysis: Support, Resistance, and Pattern Formation
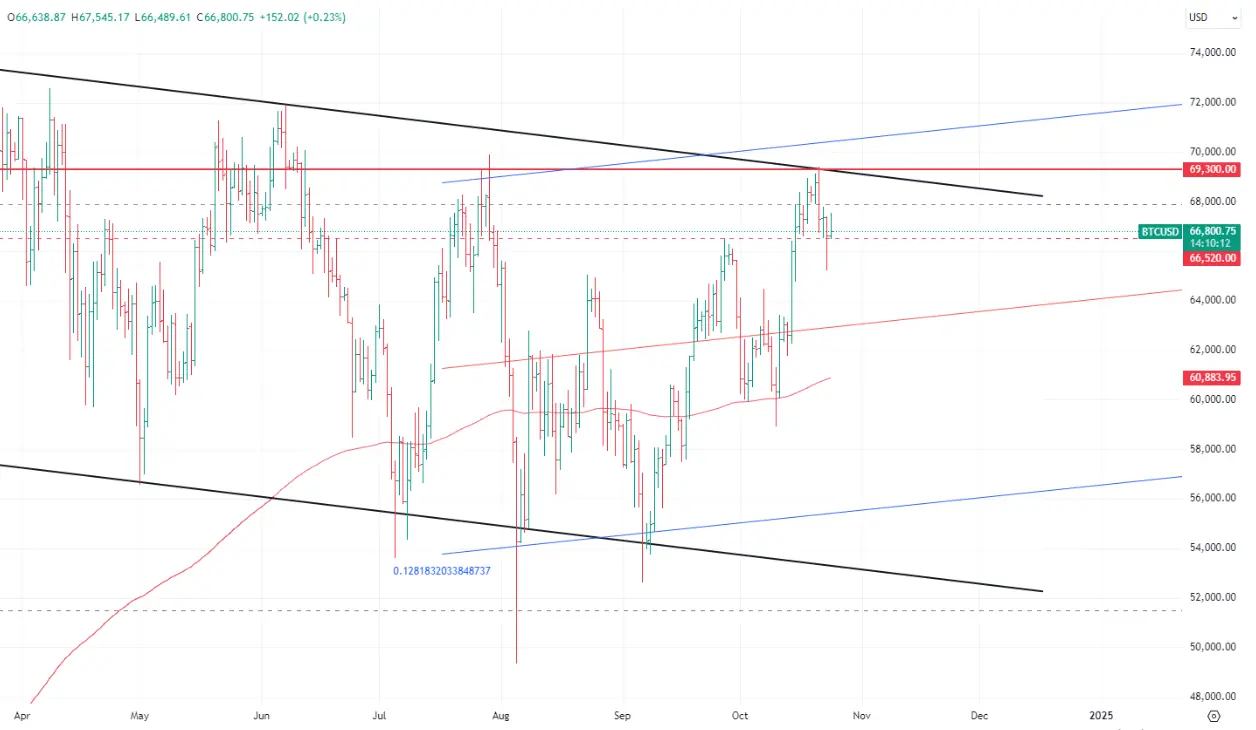
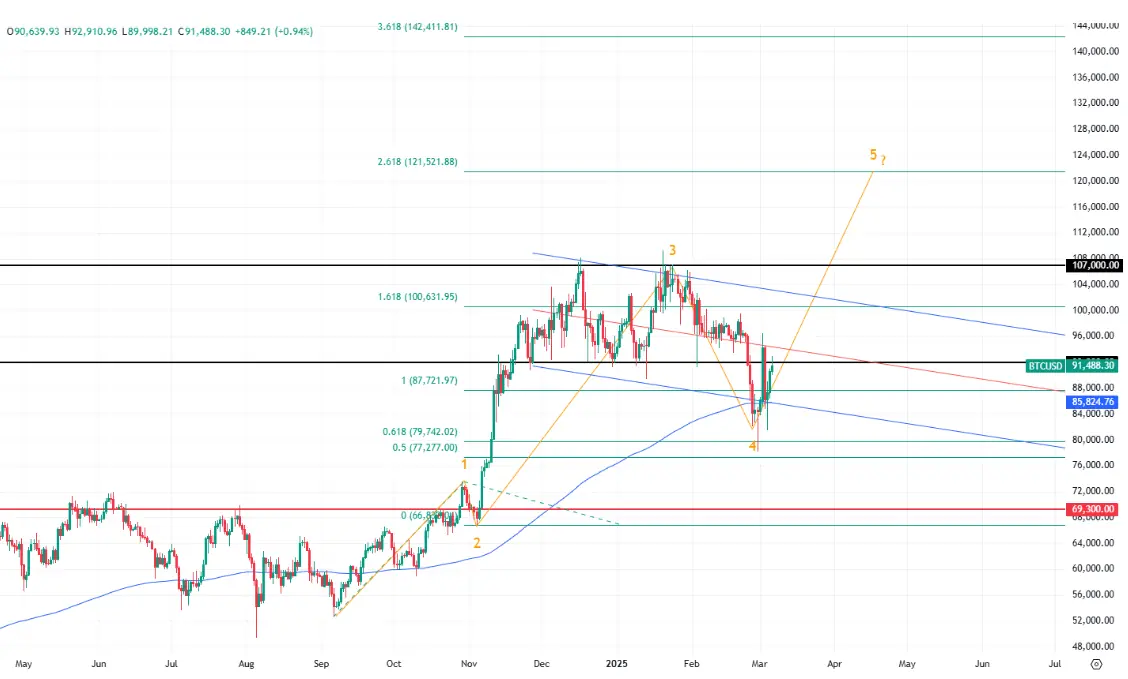
From the standpoint of technical analysis, BTCUSD breached its $92k level, subsequently testing its 200-day MA and the lower bound of a regression channel.
While an attempt was made to break below the MA, bearish momentum failed to gain traction.
Consequently, the price action bounced off the support level, retraced higher and attempted to breach the previous support line earlier at the start of this week.
That support line has turned into resistance that the bulls need to take out that mark and then secure a foothold at higher levels.
Double Top Pattern Analysis at $108-109K Range
As noted earlier, we no longer look to the head-and-shoulders pattern, which failed to materialize.
However, a double top pattern has shaped up on the weekly chart, with peaks at $108,200 in mid-December 2024 and $109,300 in late January 2025.
Wave Analysis: Two Scenarios Examined
In terms of wave analysis, our prior assessment presented two potential scenarios for BTCUSD:
A breakout above the $92k to $107k range, signaling the completion of a flat corrective fourth wave and the commencement of a final fifth wave trend impulse.
A breakdown of the $92k support level, indicating that the ongoing BTCUSD consolidation is part of the third wave, while a subsequent decline would represent the fourth corrective wave.
The latter scenario eventually prevailed. Wave analysis, however, remains subject to interpretation, meaning that alternative scenarios need to be considered.
Our base case assumes the initiation of the final fifth wave, projecting a bullish trajectory.
If accurate, BTCUSD should surpass $92k and make a new all-time high, with initial targets in the $120k to $125k range, and further upside potential.
In an alternative scenario, the fourth wave would remain incomplete, with continued corrective action.
This would imply a decline below $80k. This scenario looks less likely at this juncture.